Did today’s hotter-than-expected August 2025 CPI kill hopes for aggressive Fed rate cuts, or is it rocket fuel for crypto’s surge to a $5 trillion market cap? On September 11, 2025, the Bureau of Labor Statistics (BLS) reported headline inflation at 2.9% year-over-year (YoY), up from 2.7% in July, with a 0.4% month-over-month (MoM) gain beating forecasts of 0.3%. Core CPI held steady at 3.1%, but shelter and energy spikes fueled volatility. Meanwhile, global M2 liquidity soared to $112 trillion, and the crypto market cap hit $3.97T, eyeing $5T by year-end. For crypto traders, this CPI print isn’t a roadblock, it’s a launchpad. This guide dives into the August 2025 CPI data, its triggers for Bitcoin and altcoins, liquidity trends, and strategies to ride the wave to $5T.
1. August 2025 CPI: The Data Deep Dive
The August 2025 CPI offers a nuanced view of inflation, signaling a soft landing with persistent pressures. According to the US BLS, headline CPI, which tracks a basket of goods and services for urban consumers, rose 0.4% month-over-month (seasonally adjusted) and 2.9% year-over-year (not seasonally adjusted), up from July’s 0.2% MoM and 2.7% YoY. This aligned with YoY expectations but exceeded the anticipated 0.3% MoM gain, driven by key sectors. Core CPI, excluding volatile food and energy, increased 0.3% MoM and held steady at 3.1% YoY, consistent with July’s figures, indicating sticky underlying inflation above the Fed’s 2% target.
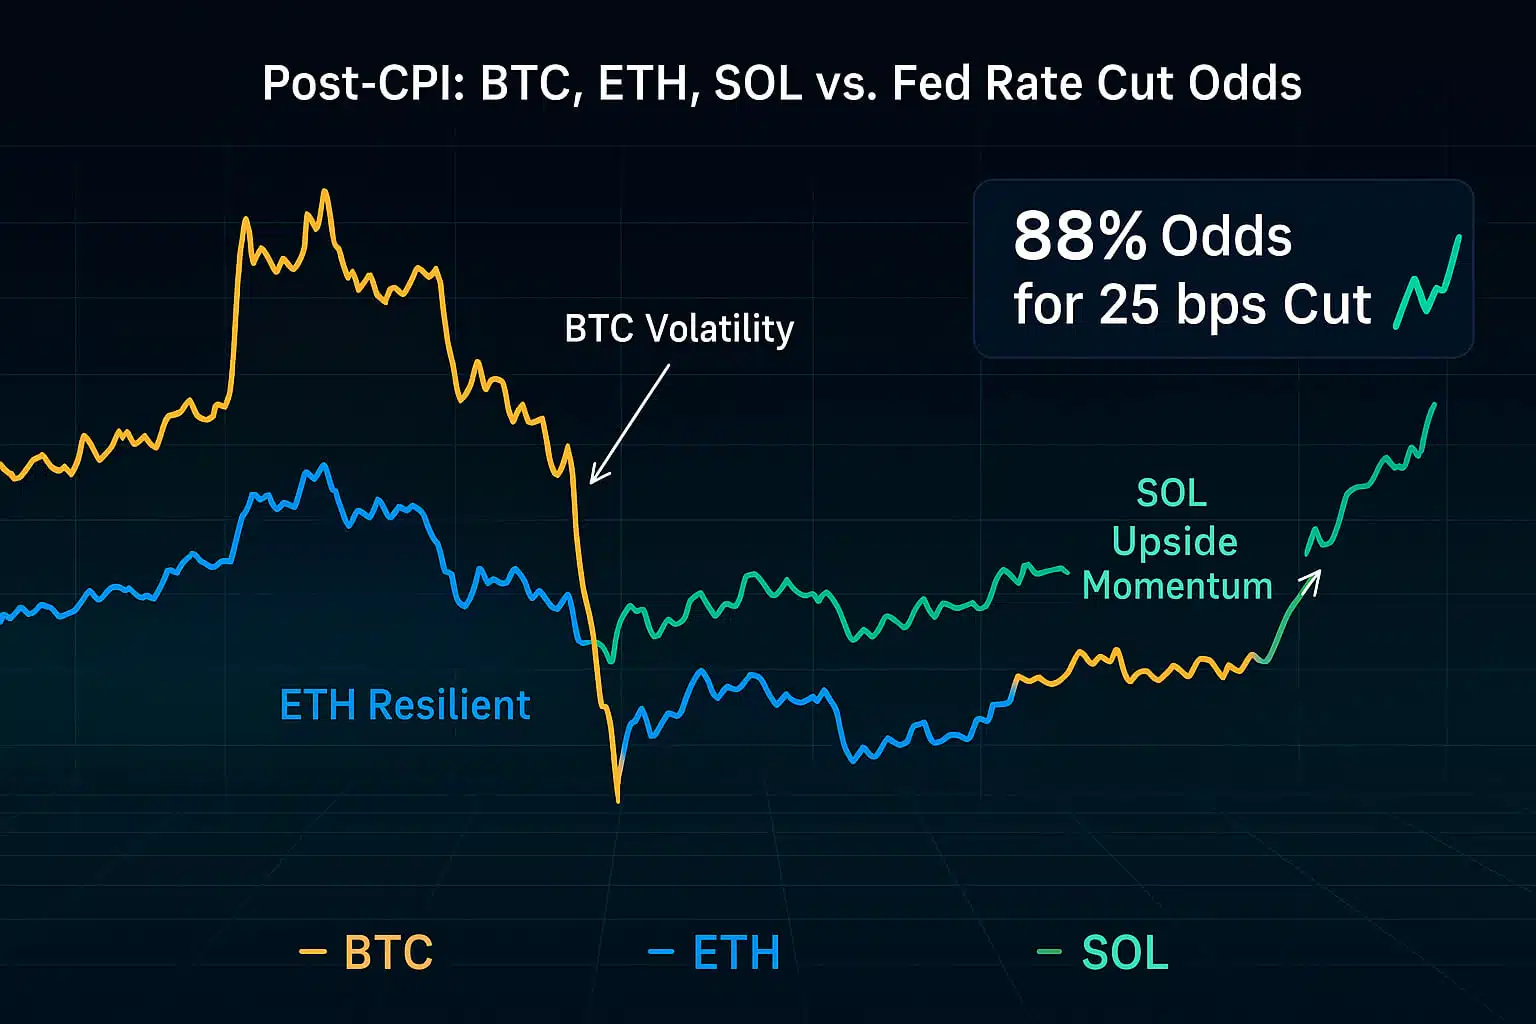
Shelter costs were the largest contributor, rising 0.4% MoM and 3.6% YoY, with rents and owners’ equivalent rent reflecting ongoing housing market pressures. Energy prices surged 0.7% MoM, led by a 1.9% jump in gasoline due to summer demand and geopolitical tensions, though energy was only up 0.2% YoY, tempered by declines in other fuels. Food prices climbed 0.5% MoM and 3.2% YoY, with groceries up 0.6% and dining out at 3.9%, driven by supply chain constraints. Compared to July, the headline CPI’s MoM rise accelerated, while core CPI remained stable. The hotter-than-expected MoM print, influenced by Trump’s import tariffs (e.g., on Chinese goods, adding ~0.2% to CPI), raised concerns about reacceleration. However, a cooler PPI (-0.1% MoM) the previous day eased fears, though jobless claims at 263K (vs. 235K expected) fueled recession worries, boosting Fed cut odds to 88% for 25 bps on September 17.
Pro Tip: Track CPI subcategories like energy on BLS.gov to gauge crypto triggers.
2. CPI Triggers: How August 2025 Ignites Crypto Volatility
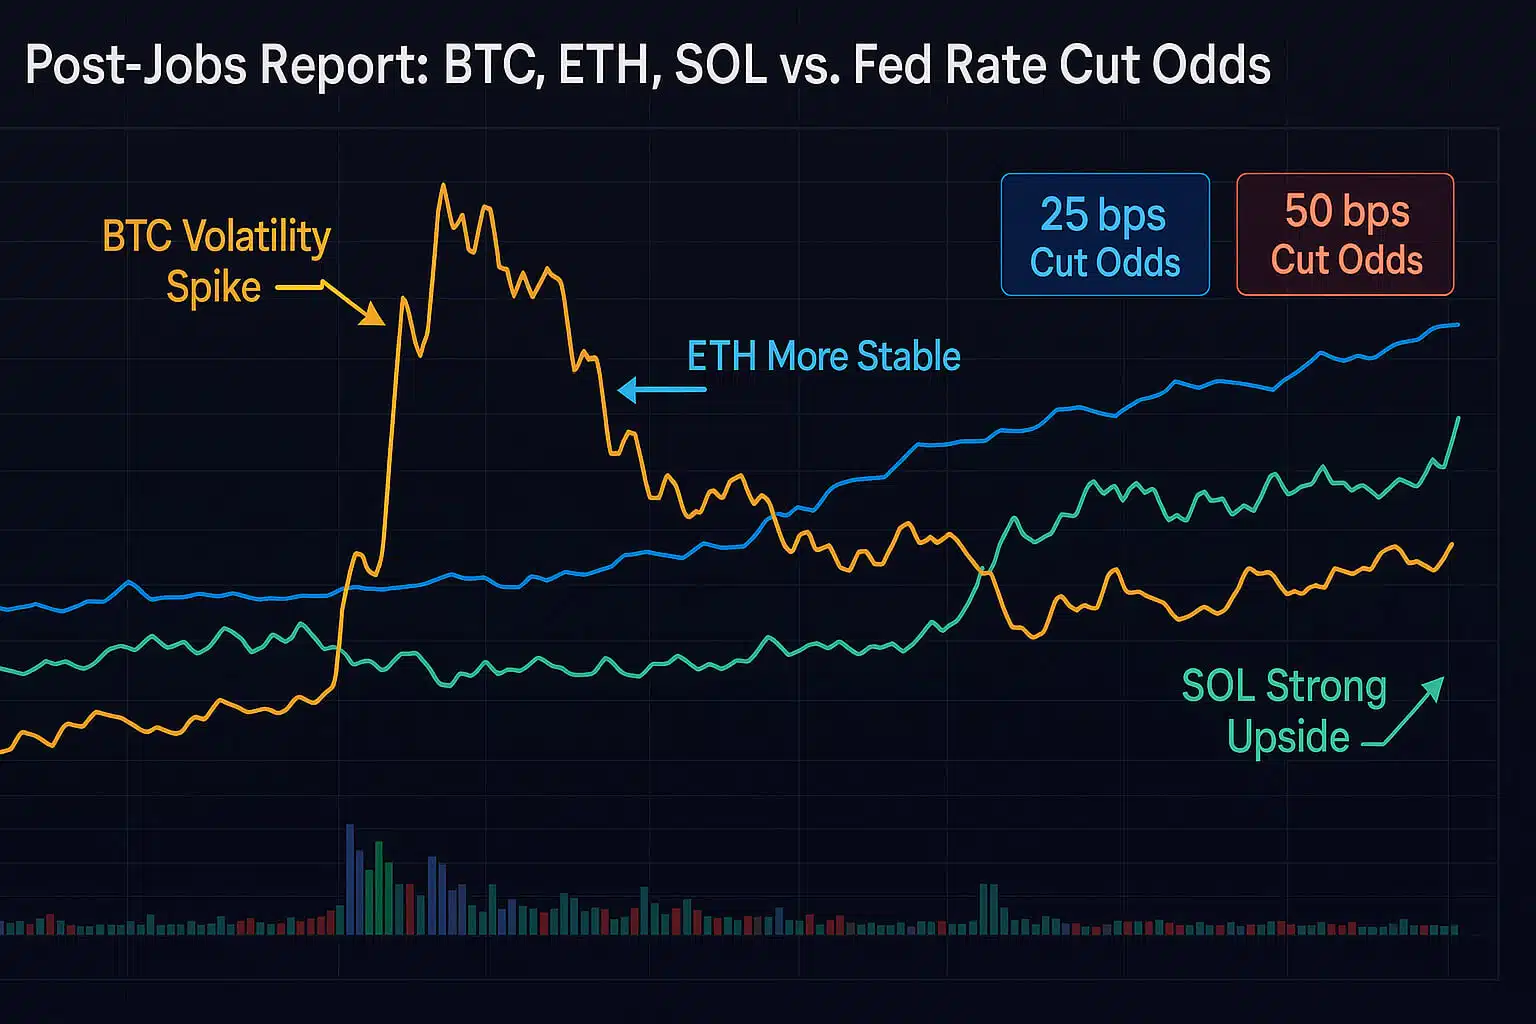
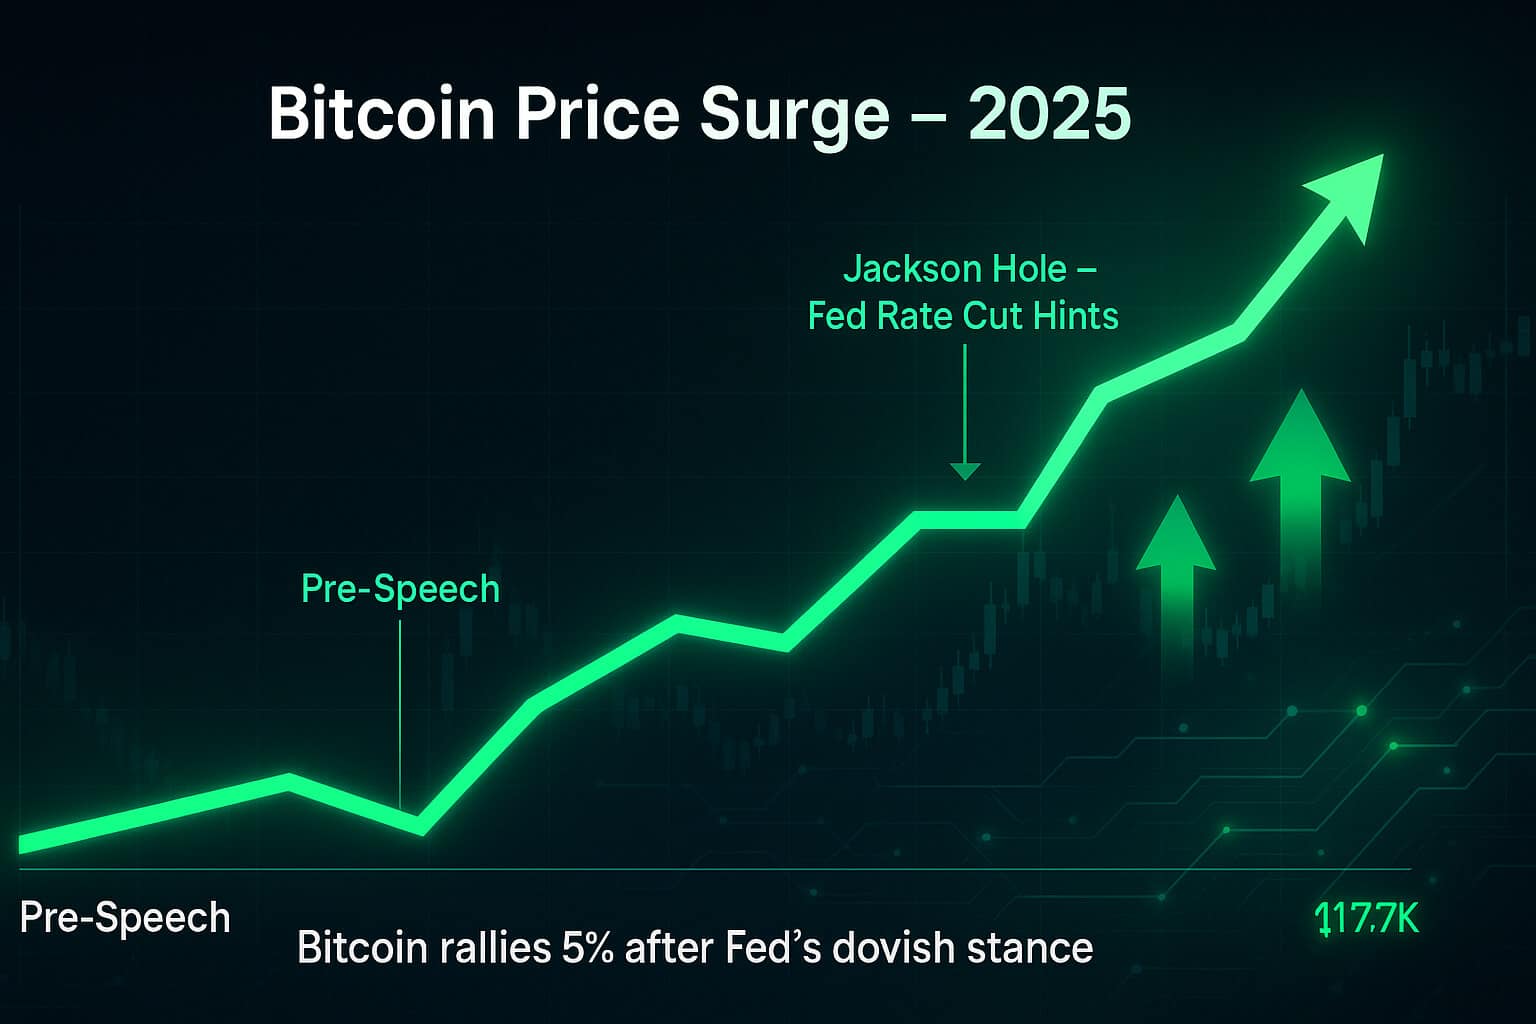
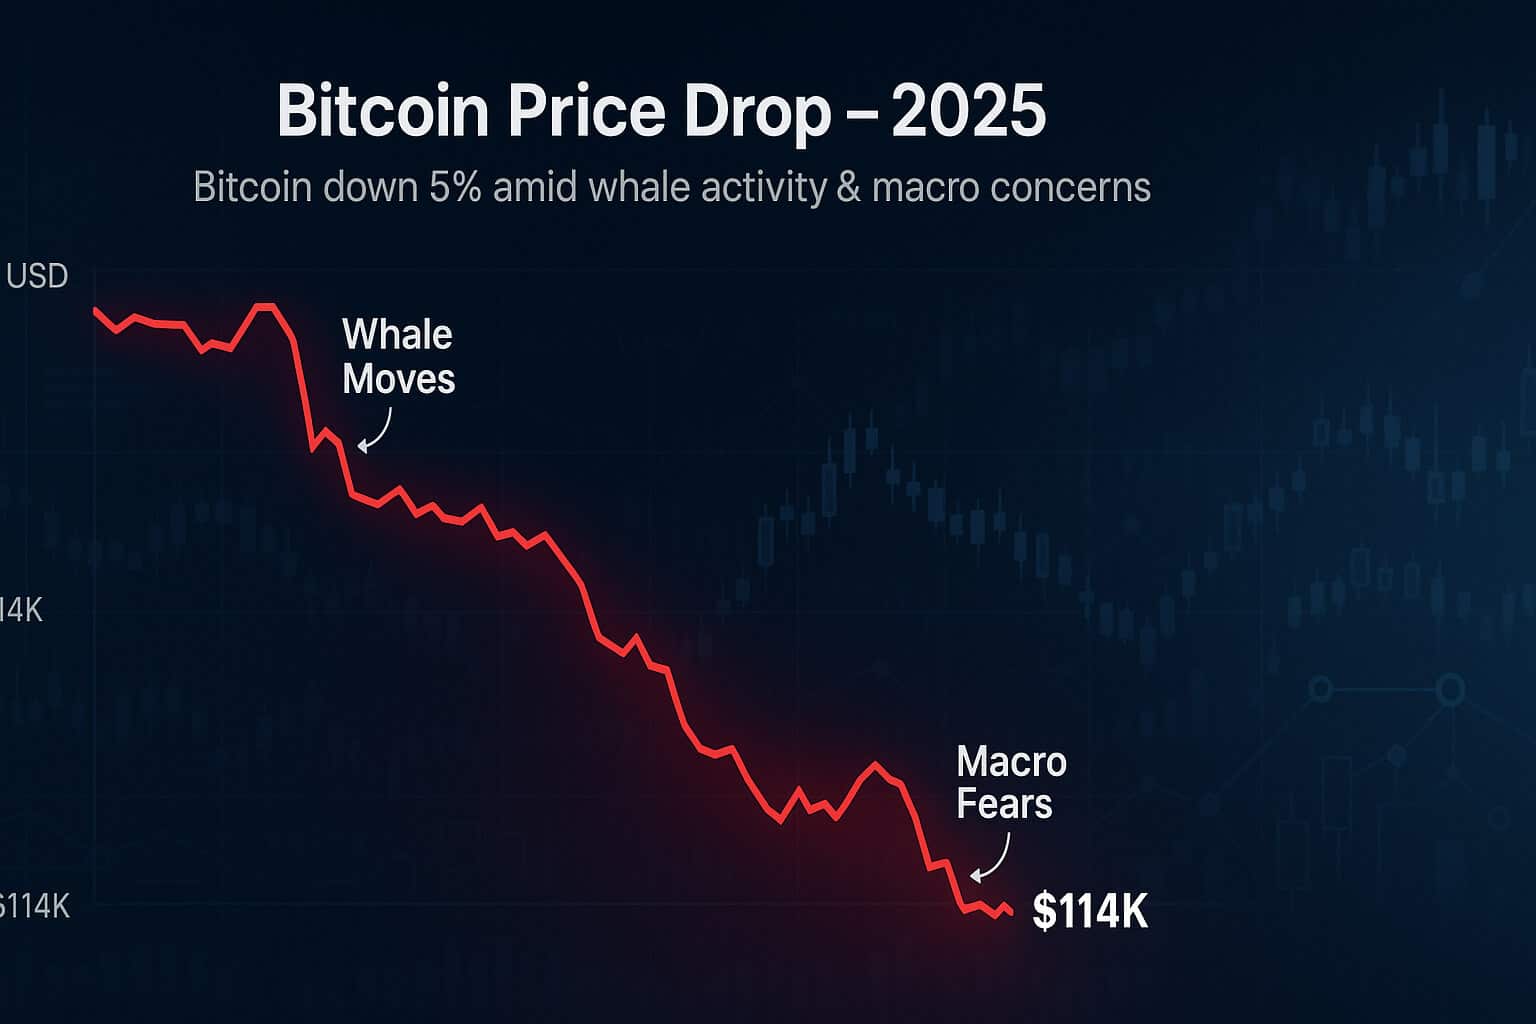
The August 2025 CPI acts as a Fed policy barometer, sparking crypto volatility. Hotter prints tighten liquidity (bearish), while cooler ones signal cuts (bullish). August’s mixed data, hot MoM, in-line YoY, triggered a 0.5% Bitcoin dip to $114,546 and a 1% Ethereum drop, but both rebounded on PPI’s disinflation signal (+0.69% and +1.77% 24h, respectively). Crypto’s ~0.7 correlation with Nasdaq ties it to risk sentiment, with high CPI strengthening the USD and pressuring BTC.
Historical Triggers:
-
Bullish (May 2025): +0.1% CPI drove BTC to $95K as cut bets surged.
-
Bearish (March 2025): +3.1% core CPI confirmed hikes, sparking a 10% altcoin pullback.
-
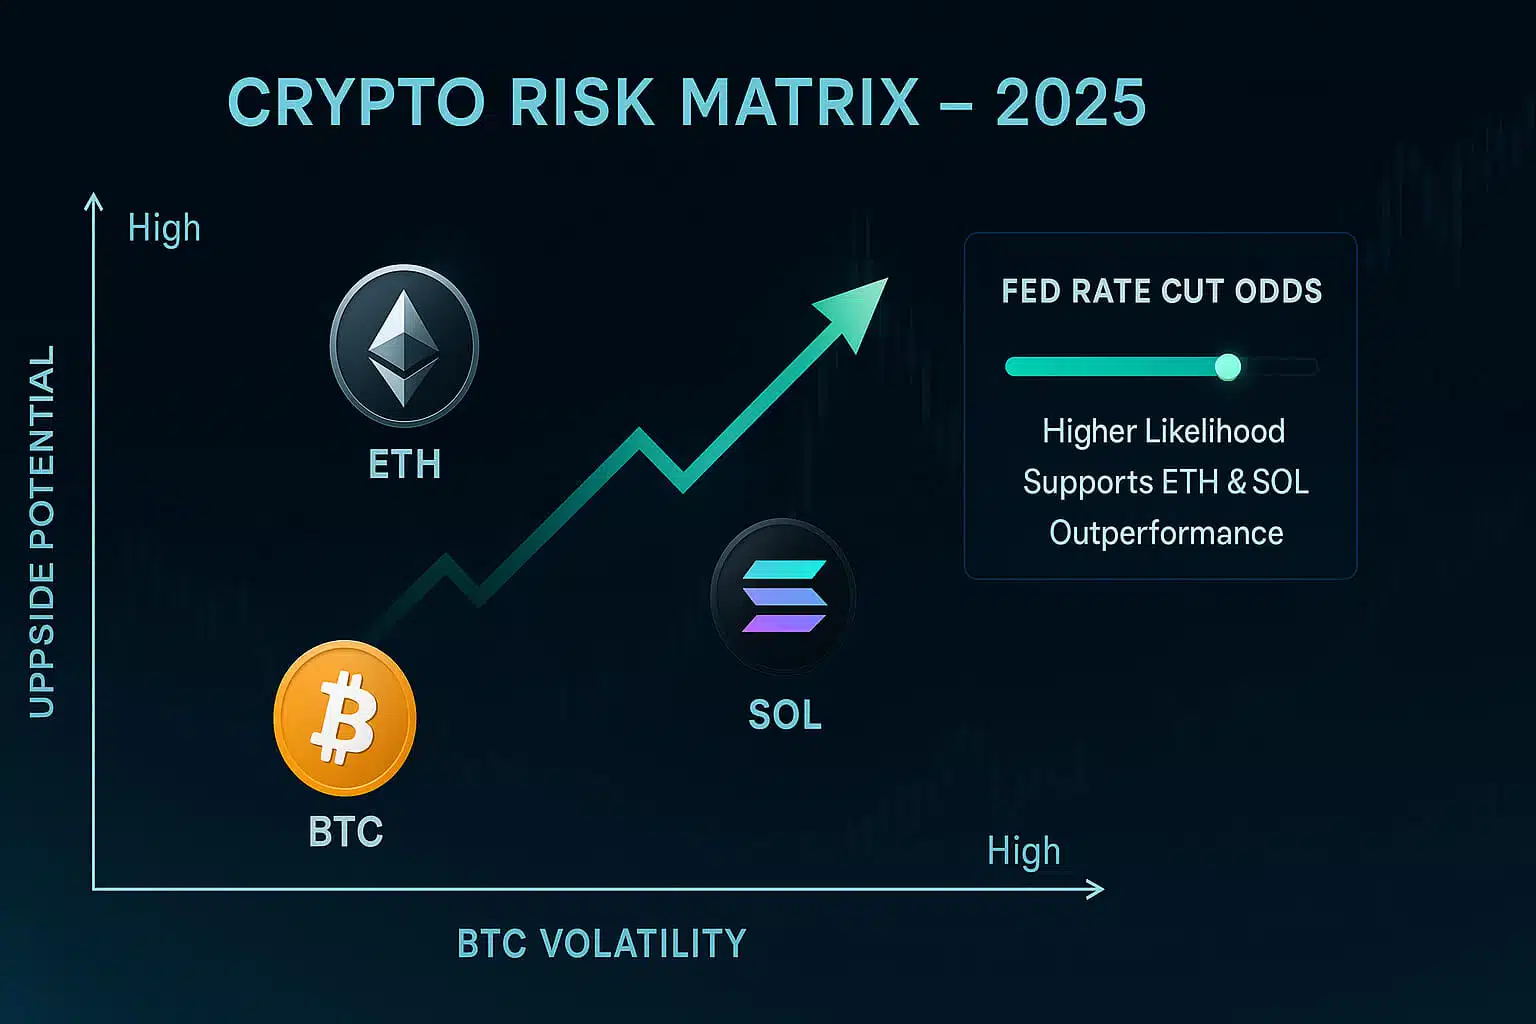
August Pattern: 5/8 CPI releases in 2025 caused >5% BTC swings; August’s “neutral-mixed” print favors altcoins like SOL (+2% 24h).
Post-Release Snapshot:
-
Bitcoin (BTC): $114,546 (+0.69%), stabilized on rate cut hopes. X: “Disinflation shock → rocket fuel for crypto”
-
Ethereum (ETH): $4,433 (+1.77%), poised for altseason.
-
Solana (SOL): $222.34 (+11.18% 7d), outperforming on DeFi momentum.
-
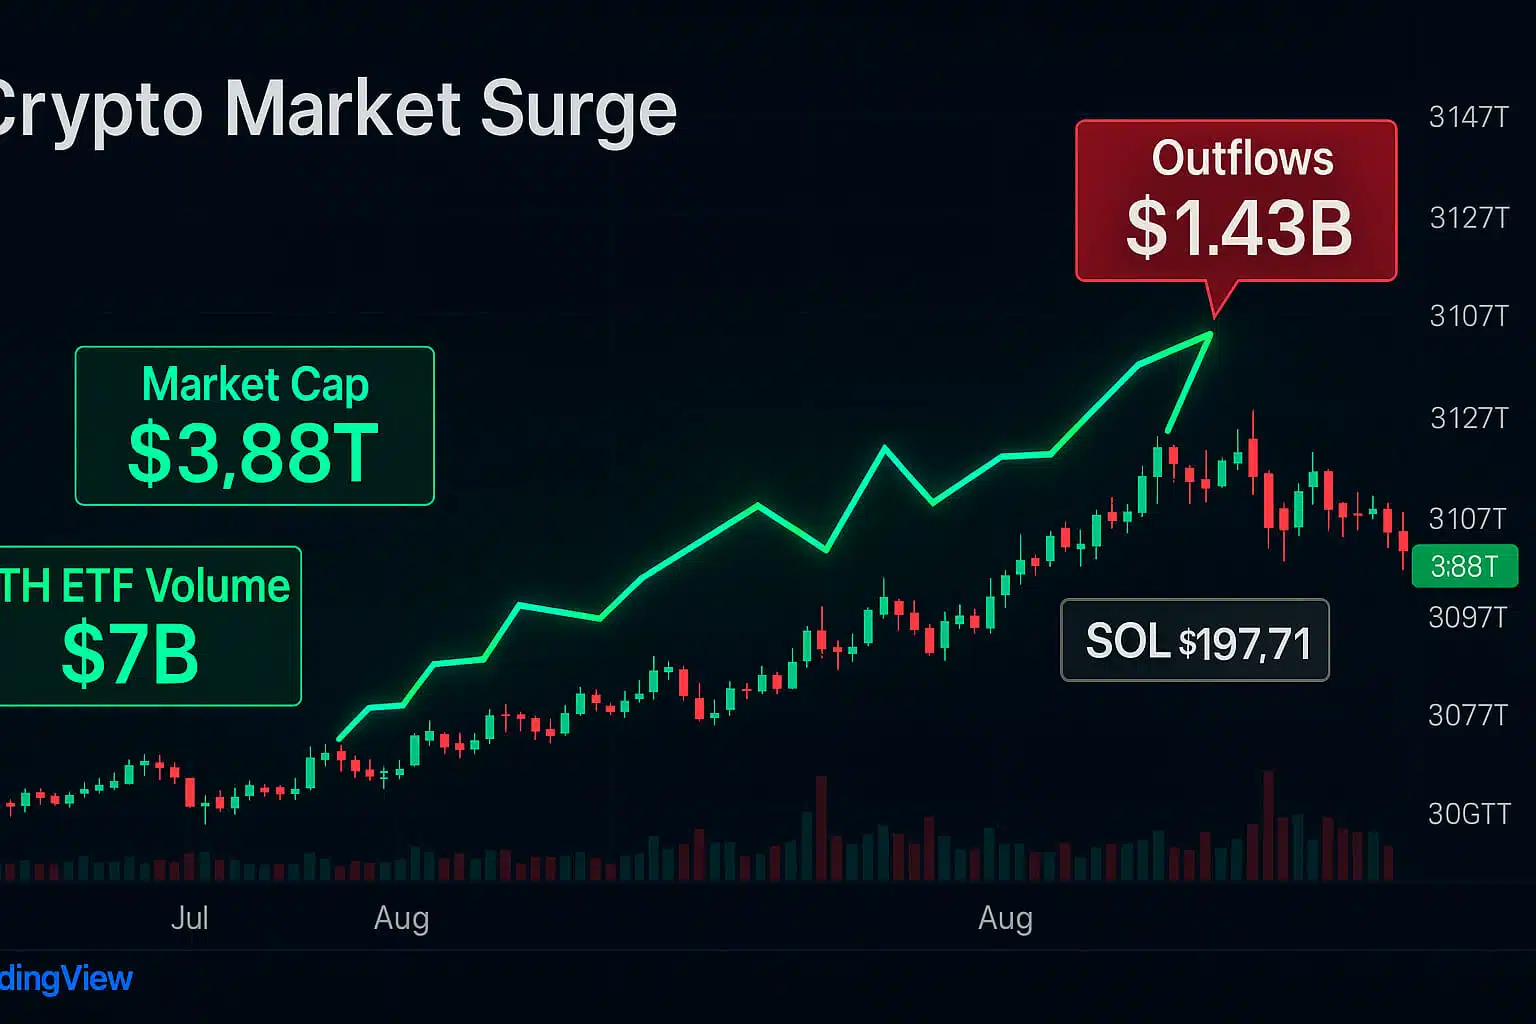
Market Cap: $3.97T, up 0.74% 24h, down from August’s $4.17T peak.
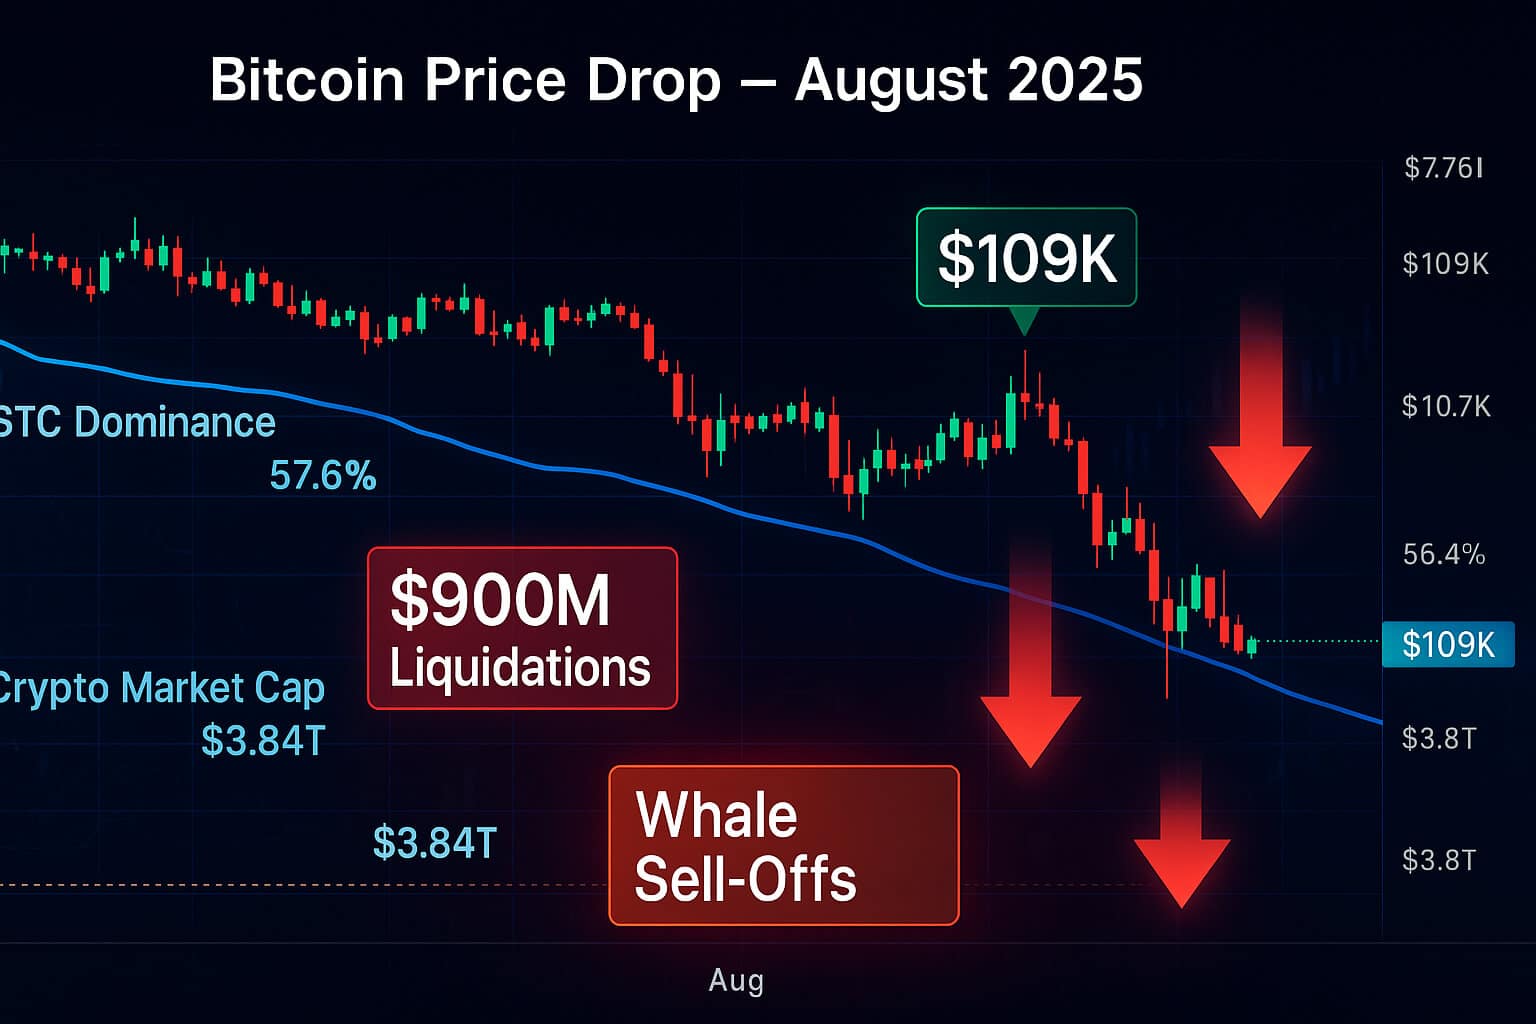
Why It Matters: High CPI erodes fiat trust, boosting BTC as “digital gold,” but leveraged liquidations ($1B+ in August) amplify swings.
SEO Boost: “How August 2025 CPI Triggers Bitcoin and Altcoin Volatility”
3. M2 Fuels Crypto’s Rally
Global liquidity, measured by M2 (cash + deposits), is a key driver for crypto’s path to $5T. In July 2025, US M2 reached $22,115 billion, reflecting a 5.1% year-over-year increase, signaling a reacceleration of money supply growth. Meanwhile, global M2 hit $95 trillion in July and surged to $112 trillion by September 2, marking an 8.34% year-over-year growth, fueled by post-2020 quantitative easing and China’s $1.5T stimulus. The crypto market cap, which peaked at $4.17 trillion in August, stood at $3.97 trillion on September 2. Projections suggest US M2 could grow 4-6% by year-end, with global M2 expanding 8-10%, potentially pushing the crypto market cap beyond $5 trillion.
This liquidity surge supports risk assets like crypto when interest rates fall. For instance, the $112 trillion global M2 signals excess capital chasing yields, with crypto absorbing over $7 billion in corporate treasury investments (primarily BTC, ETH, and SOL) in August alone. The interplay with CPI is critical: at 2.9%, inflation allows M2 growth without aggressive rate hikes, and Fed cuts could add $1-2 trillion in liquidity. Historically, M2 growth lags Bitcoin price movements by 10-13 weeks, with the current surge predicting a potential $150K BTC by Q4. However, risks loom, if quantitative tightening resumes, M2 contraction could trigger a 20% crypto dip. Low M2 velocity (1.4 vs. 1.8 pre-2020) fuels asset bubbles, amplifying crypto’s upside but also its volatility.
Pro Tip: Monitor M2 updates on FRED to anticipate crypto rallies.
Special Offer

4. Crypto’s Path to $5T: Projections and Drivers
The crypto market cap stands at $3.97T (September 11, 2025), up 0.74% in 24 hours but down from August’s $4.17T peak. With BTC dominance at 57.48% (-0.05%), altcoins like Solana (+11.18% 7d) signal an altseason brewing. Can it hit $5T by year-end?
Projections:
-
Bull Case ($5T+): Fed cuts (25 bps likely) and $7B+ ETF inflows drive 25% growth. CZ predicts BTC $500K-$1M, total cap $5T; VanEck eyes BTC $180K.
-
Base Case ($4.5T): Moderate cuts, stable M2 growth; XRP/ETH at $5/$25K if BTC hits $150K.
-
Bear Case ($3T): Hotter CPI or QT resumption sparks 20-30% drawdown.
Drivers:
-
Macro: Fed cuts and US-China trade deals boost liquidity.
-
On-Chain: 37M+ unique cryptos, with top 100 holding value; whale accumulation up (exchange reserves down to 2.4M BTC).
-
Narrative: BTC as an inflation hedge amid USD’s 25%+ value loss since 2020. X: “Markets choppy, but Fed cuts fuel risk-on” [post:18].
Roadblocks: Sticky core CPI (3.1%) or tariff-driven inflation could delay cuts, strengthening USD and capping crypto gains. September’s historically weak BTC performance adds risk.
SEO Boost: “Crypto Market Cap Prediction 2025 $5 Trillion”
5. Strategies to Ride the $5T Wave
To navigate August 2025 CPI volatility and target $5T gains:
-
Track Fed Signals: Watch FOMC (Sept 17) and Powell’s comments for cut clarity. A 25 bps cut could lift BTC to $120K+.
-
Hedge with Stablecoins: Allocate to USDT/USDC via Binance, Bybit or OKX to buffer CPI-driven dips.
-
Follow X Sentiment: Monitor @CoinMarketCap for real-time shifts: “PPI cools → Fed less hawkish, liquidity flowing to crypto”
-
Prioritize Alts: SOL’s 11.18% 7d gain signals DeFi strength; consider ETH/SOL over memes.
-
Avoid Leverage: $1B+ August liquidations highlight risks in volatile markets.
Pro Tip: Use CoinMarketCap to track SOL/ETH support levels ($200/$4,000) for entry points. Stay ahead of August 2025 CPI impacts with Freecoins24.io for market updates and Bybit for trading. Follow @CoinMarketCap on X for sentiment and BLS.gov for CPI data. Beware of scams and never share your private keys.
Seize Crypto’s $5T Opportunity
The August 2025 CPI at 2.9% YoY, paired with $112T global liquidity, underscores crypto’s resilience. Short-term dips from sticky inflation are outweighed by Fed cut hopes (88% for 25 bps) and M2’s 8.34% surge, paving the path to a $5T market cap. Bitcoin ($114,546), Ethereum ($4,433), and Solana ($222.34) are poised for gains, with altcoins leading if liquidity floods.