Bitcoin has just rebounded sharply, rising 4.2% in the last 24 hours to above $94,000 from a recent low of $89,586. This move comes after a punishing 26% drop from the October all-time high of $126,198, leaving many traders wondering if this is just a temporary relief rally or a true turning point in the trend. To put it simply, a local bottom here would indicate that the market has exhausted sellers and is ready for the next upward leg, whereas a failure to hold could indicate more downside testing. Let’s take a step-by-step approach with clear data and explanations to help you understand the signals involved.
1. Bitcoin’s 24-Hour Bounce: A Closer Look at the Technical Indicators Pointing to a Bottom
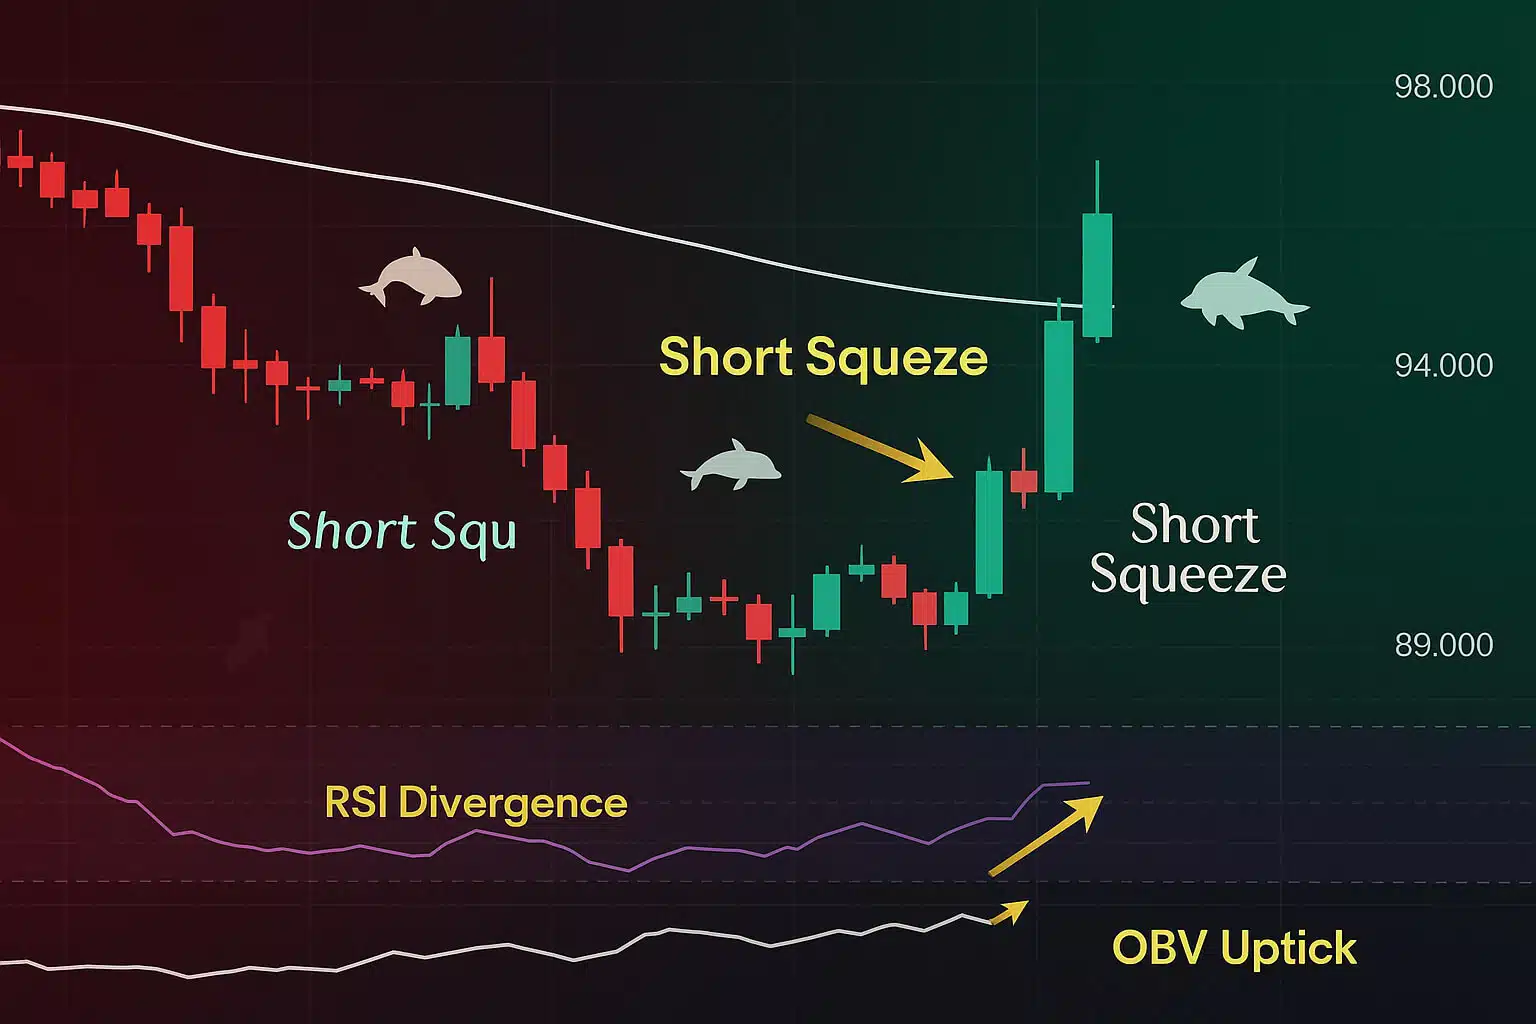
On both the daily and weekly timeframes, Bitcoin’s recent price action is forming a “rounded bottom” pattern, according to technicians. This pattern typically indicates a gradual shift from downward momentum to upward reversal, in which selling pressure fades and buyers take control. Explicitly, this is supported by the On-Balance Volume (OBV) indicator, which shows bullish divergence; even as prices fell to lower lows, buyer volume increased, indicating accumulation rather than capitulation.
From a perceptive standpoint, sharp voices on X are aligning around this narrative, albeit from different angles. For example, K33 Research emphasizes how markets are overreacting to perceived long-term risks while ignoring the underlying strength in low-leverage spot demand, providing a macro perspective on the discussion. @Sykodelic emphasizes the importance of a close above $94K to confirm the low, with a focus on short-term price movements. @Bitbei offers a granular technical angle, citing higher highs on the 1-hour chart combined with anchored VWAP support as evidence of a bottom. @KazBTC adds on-chain context with ATH capitulation, whale buys, and RSI divergence, viewing it as a cycle reset. Finally, @JAVLIS sees the entire 30% drawdown as a healthy refresh for long-term holders, offering an upbeat, big-picture perspective that balances the short-term noise.
On the bearish side, the daily trend remains explicitly downward, with a series of lower highs and lows, as well as a bearish EMA stack in which shorter moving averages are placed below longer ones. To fully turn bullish, we need a conviction close above the 50-day EMA at around $98K on high volume.
2. The Altcoin Market: Explaining the Current Pain and How It Sets Up Extreme Opportunity
While Bitcoin is showing signs of recovery, altcoins are experiencing extreme capitulation, which explicitly means widespread selling at a loss as fear takes hold. The TOTAL2 index (altcoin market cap excluding BTC) has fallen 20-40% year to date against Bitcoin, increasing BTC dominance to 55.5% and rejecting the 50-week moving average, which has historically signalled prolonged altcoin weakness.
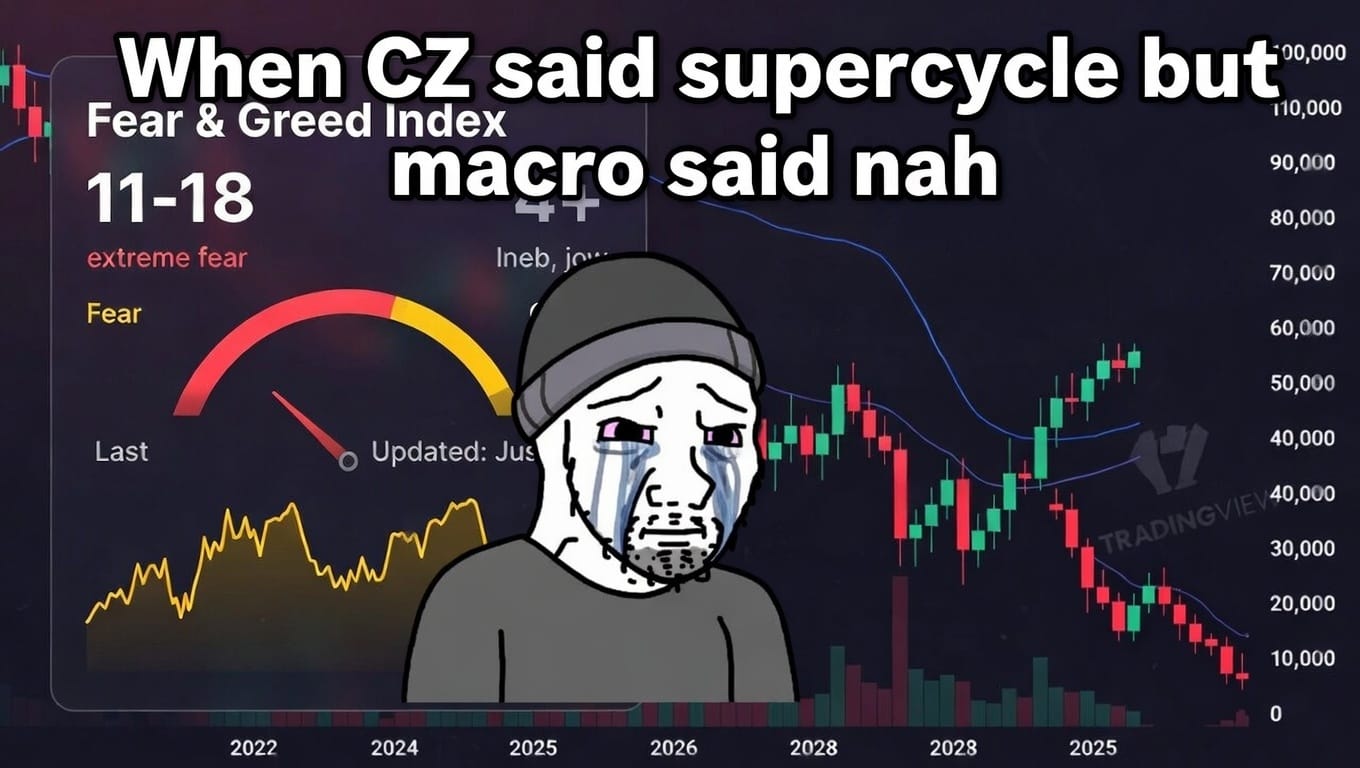
The Fear & Greed Index hovers between 23 and 28, clearly in “extreme fear” territory, exacerbating the pain as sentiment turns sour with comments like “alt season is dead” or “permanent capital impairment.” From a perceptive standpoint, this setup resembles historical extremes where oversold conditions result in violent rebounds.
Contrarian indicators are flashing green: the ALT/BTC monthly chart is breaking out of a 4.5-year falling wedge pattern, which indicates the end of a downtrend and the start of an uptrend. Major altcoins such as ETH, SOL, BCH, and XRP are showing bullish deviations from their cycle lows, indicating that they are holding key supports better than expected. Historically, 2019’s 0.25 capitulation on ALT/BTC preceded the explosive 2020-2021 altseason, indicating that current pain frequently precedes opportunity.
The consensus on X is perceptive here, alts remain toxic and will continue to bleed until BTC dominance falls below 54% and stabilizes. Once that happens, a violent catch-up rally is highly likely, fueled by historical patterns and pent-up demand.
3. Price Targets for Q1 2026: An Analysis of Expert Forecasts and Supporting Factors
With the fourth halving now 20 months behind us, which explicitly reduced supply issuance by half, and favorable liquidity conditions emerging (end of QT, expected rate cuts, and $1T+ M2 money supply expansion), Q1 2026 targets are overwhelmingly bullish. Here is a detailed look at the distribution from X analysts and institutional desks, with explicit theses.
- Tom Lee (Fundstrat) expects $150K-$200K in BTC, driven by accelerating ETF inflows and broader global adoption, and sees the asset class maturing.
- Sykodelic targets $200K or more, based on a liquidity cleanse that flushes weak hands and $17B in shorts ready for squeezes, as well as a perceptive short-term momentum angle.
- Hailey LUNC / Lofty forecasts $210K, citing the end of market manipulation and the impending parabolic euphoria, as well as a keen sense of sentiment shifts.
- Bitcoin Professor predicts $138K-$152K from ETF turbocharging and corporate treasury FOMO, citing institutional demand.
- Daves_Metaverse forecasts $170K for 1-2 rate cuts, which will flip overall market sentiment and provide macro perspective.
- JPMorgan (informal) predicts a price of ~$150K+ for Bitcoin, challenging gold’s market cap and offering a compelling long-term value story.
- Polymarket and Nasdaq models estimate $130K-$140K for cycle extension post-dip, based on historical extensions.
- Standard Chartered (revised) maintains a conservative $100K base for 2025, recognizing risks following the recent drawdown.
- With a perceptive cycle-end thesis, the bearish minority predicts $50K-$60K if $126K is the true top.
By March 31, 2026, the median from these credible sources ranges between $150,000 and $180,000, supported by liquidity tailwinds and historical post-halving patterns that favour upside.
Is $89K the lowest price?
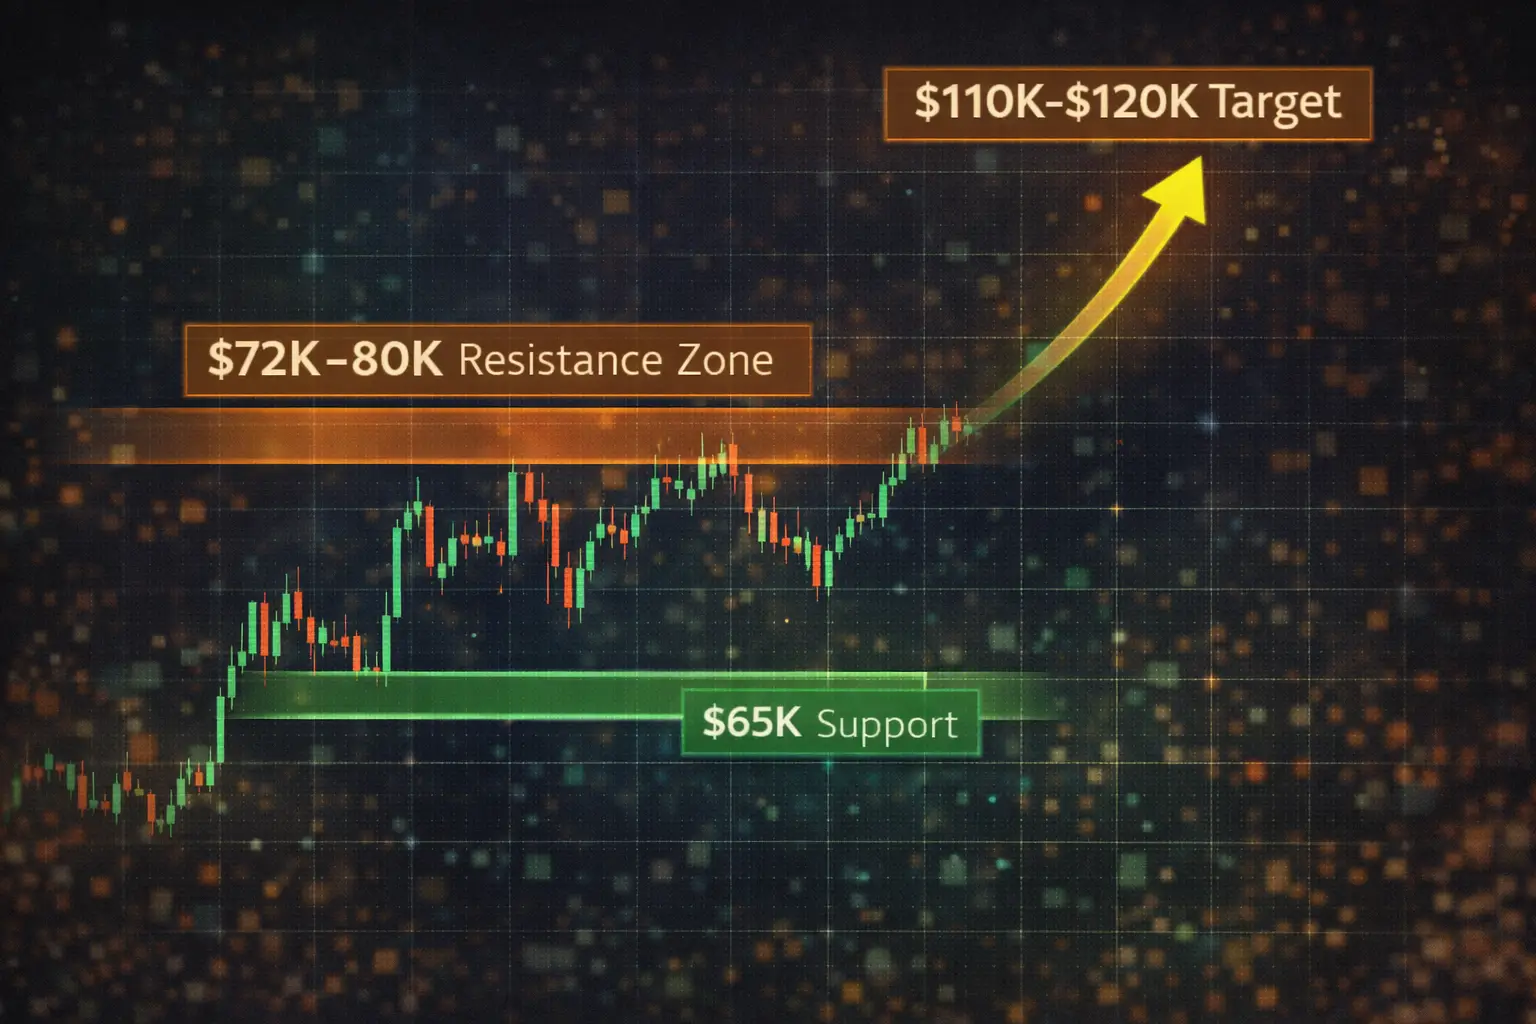
Putting it all together, the 24-hour bounce, on-chain resets such as SOPR exhaustion, and sentiment washout all point to a high-probability local bottom of $89K-$90K. The broader bull structure remains intact, with most analysts expecting sharp price increases over the next 3-6 months.
However, given the volatility of crypto, one hawkish Fed comment or macro shock could invalidate this – explicitly watch for confirmation. The key indicators are BTC dominance, the 50-day EMA, and volume. A weekly close above $98K would clearly indicate the next leg up.
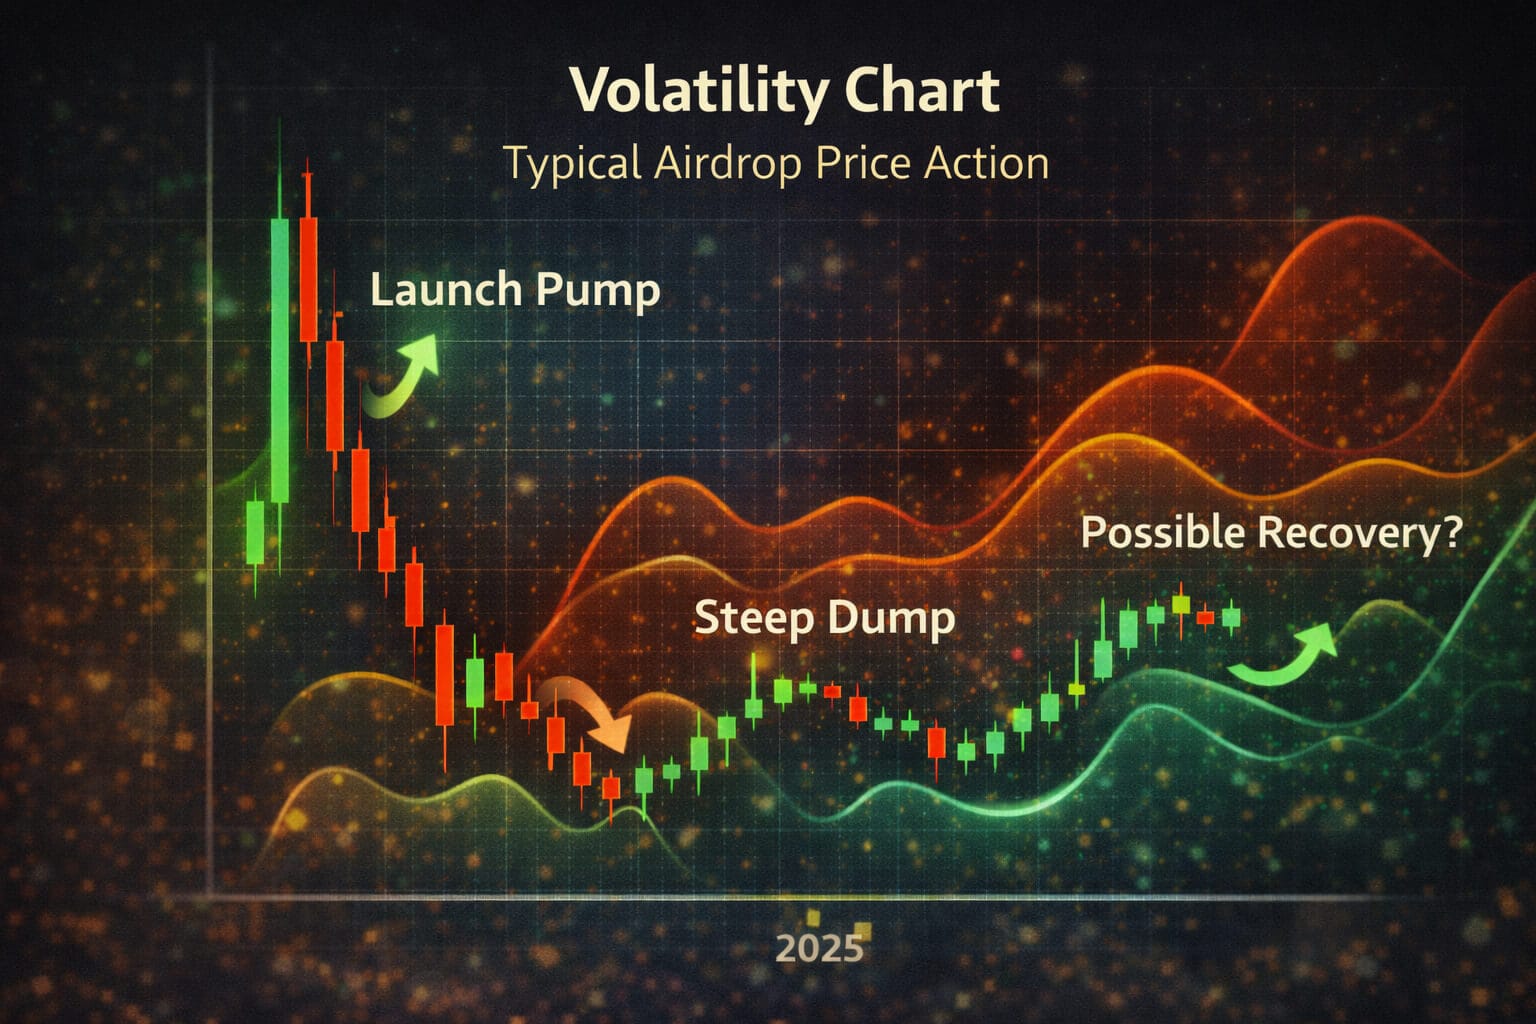
Visit our Crypto Market Updates for more information and educational resources on Bitcoin’s 4% bounce in 24 hours and Q1 2026 forecasts. Do you want more detailed analysis and airdrop opportunities? Visit FreeCoins24.io/airdrops to learn about the most recent free cryptocurrency drops.
Keep Up to Date
Keep up to date with the latest crypto airdrops, strategies, and tips. Connect with us on:
FreeCoins24.io provides the most up-to-date cryptocurrency strategies and insights.