In the world of blockchain, airdrops have become a popular way for projects to distribute tokens, attract users, and create community engagement. However, identifying effective airdrop patterns with analytics can give projects an edge. By using blockchain analytics tools, you can uncover key trends in past campaigns, helping you design more impactful airdrops. Whether you’re a project manager or a crypto enthusiast, learning how to analyze airdrop patterns with data can enhance your strategies.
2. Key Analytics Platforms for Understanding Airdrop Trends
Several analytics platforms offer insights into blockchain data, allowing you to track and analyze airdrop campaigns. Here are some of the best tools to consider:
a) Nansen
Nansen provides powerful insights into on-chain data, especially for tracking token movements and wallet behaviors. With Nansen, you can:
- Follow Token Flows: See where airdropped tokens go after distribution.
- Identify Key Wallets: Spot wallets that participate actively in airdrops or sell quickly.
- Analyze Holding Behavior: Understand if users are holding airdropped tokens or selling them immediately.
This level of detail helps you pinpoint airdrop patterns related to user engagement and token movement.
b) Dune Analytics
Dune Analytics is a customizable platform that lets users create their own dashboards for Ethereum data analysis. With Dune, you can:
- Build Custom Airdrop Queries: Track specific data related to airdrop distributions and token flows.
- Monitor Real-Time Airdrop Activity: Analyze how tokens are being claimed and moved in real time.
- Share Insights: Access community dashboards to see how others are analyzing similar data.
Dune’s flexibility makes it an ideal choice for those who want tailored insights into airdrop patterns.
c) Glassnode
Glassnode specializes in on-chain and financial data for various crypto assets. It provides key metrics to track how airdrops affect token behavior. Key features include:
- Market Indicators: See how airdrops impact trading volumes and volatility.
- User Holding Patterns: Track if airdropped tokens are held long-term or sold off quickly.
- Exchange Data: Analyze token inflows and outflows from exchanges after an airdrop.
With Glassnode, you can gain insights into how airdrops affect token price and overall market sentiment.
d) Into TheBlock
Into TheBlock provides blockchain analytics for multiple networks, offering insights into holder behavior and token flows. Key features include:
- Holder Distribution: See how airdropped tokens are distributed among users.
- User Sentiment Analysis: Track community reactions to airdrops based on engagement.
- Token Flow Insights: Understand how tokens move post-airdrop, revealing patterns of distribution and use.
These tools allow you to see the bigger picture and identify key trends across multiple airdrop campaigns.
3. Essential Metrics for Analyzing Airdrop Patterns
Once you have access to analytics platforms, it’s essential to know which metrics to monitor. Here are some key indicators:
a) Retention and Token Holding Period
Analyzing how long users hold onto their airdropped tokens is critical. A high retention rate suggests strong interest in the project, while a quick sell-off indicates less committed participants. By understanding holding patterns, you can determine the level of engagement generated by an airdrop.
b) Distribution of Tokens
Track where tokens end up after they’re airdropped. If a significant amount of tokens are concentrated in a few wallets, this might indicate speculative behavior. A more even distribution generally signals widespread interest and engagement. Analytics tools allow you to track how tokens are spread out, offering insights into the behavior of recipients.
c) Impact on Token Price and Volume
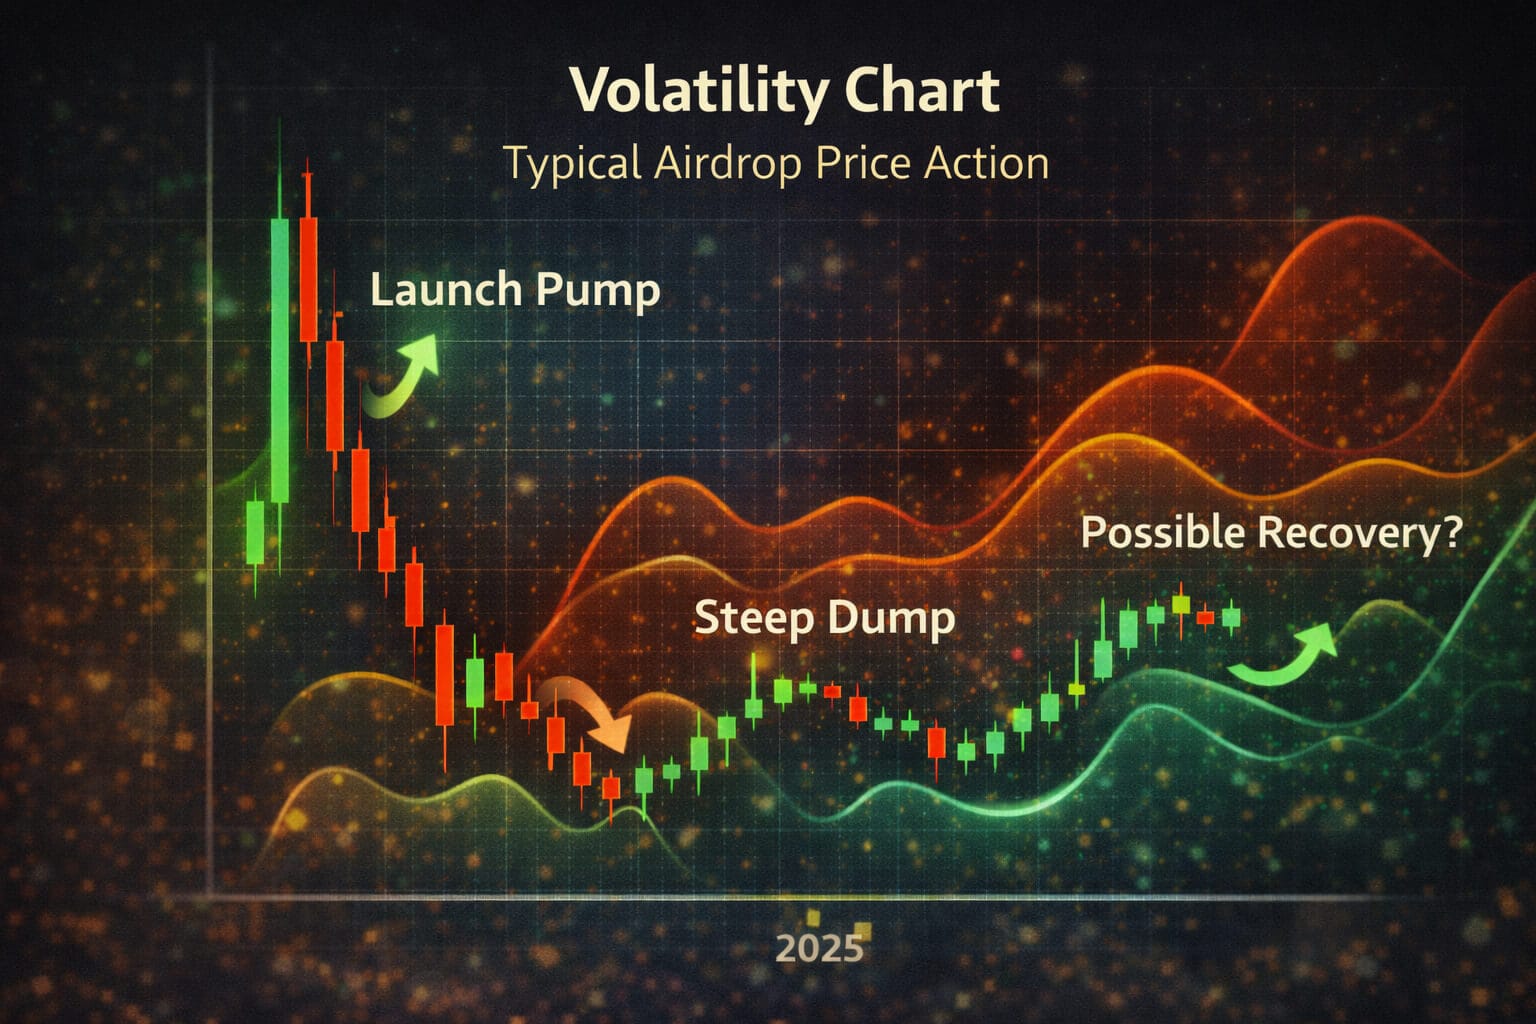
It’s crucial to see how an airdrop influences token price and trading volume. A sharp increase in volume followed by a price drop can suggest that many recipients sold their tokens. Stable price behavior, however, might indicate that the airdrop attracted genuine users interested in the ecosystem.
d) Participation Rates and Community Growth
The participation rate in an airdrop shows how many eligible users actually claimed tokens. High participation rates often reflect strong community interest. Moreover, monitoring ongoing engagement after the airdrop reveals if users continue to interact with the platform or disengage after receiving their tokens.

4. Applying Analytics Insights to Future Airdrop Campaigns
Using data from past airdrop campaigns allows you to make smarter choices for future campaigns. Here’s how you can use these insights:
a) Timing Your Airdrop for Maximum Impact
Data from analytics platforms can help determine the best times for an airdrop. Projects often find that airdrops scheduled around major updates or events attract more participants. Analytics can reveal if certain times yield higher engagement, helping you optimize the timing of future airdrops.
b) Targeting the Right Users
With analytics, you can identify segments of users who engage more actively with the project. Users who participate in governance, hold tokens for extended periods, or engage in other activities can be valuable targets for airdrops. Focusing on these users increases the likelihood that your tokens will end up in hands of committed participants.
c) Learning from Competitors’ Airdrop Strategies
Blockchain analytics platforms allow you to track airdrops from competing projects. Analyzing successful airdrops in your industry can offer inspiration and insight for your own campaigns. For instance, you can look at how other projects structured their airdrops, the distribution methods they used, and the impact on user engagement.
5. Emerging Trends: The Future of Airdrop Analytics
As blockchain technology advances, analytics tools are becoming more powerful, leading to new trends in airdrop analysis:
- Predictive Analytics: Some analytics platforms are starting to use predictive algorithms to forecast airdrop outcomes based on historical data. This helps projects make data-driven decisions on how to structure campaigns for maximum impact.
- Behavioral Segmentation: Advanced analytics may soon enable projects to segment users based on behavior, allowing more targeted and efficient airdrop distribution.
- Real-Time Monitoring: Real-time analytics tools allow projects to track airdrop performance as it happens, enabling immediate adjustments to improve engagement or reduce sell-offs.
These trends will likely make airdrop campaigns more data-driven and effective than ever before, allowing projects to fine-tune their strategies based on real insights.
Conclusion
Using analytics to identify airdrop patterns offers valuable insights into what makes a campaign successful. By tracking data on user behavior, token distribution, price impact, and participation rates, projects can create airdrop strategies that attract committed users and drive meaningful engagement. For crypto enthusiasts, understanding these patterns can also help in identifying promising airdrops to participate in.
As blockchain technology and analytics tools evolve, the ability to spot trends and optimize airdrop campaigns will become increasingly accessible, benefiting both projects and users in the growing crypto ecosystem.
For more tips on blockchain strategies, check out our Crypto Insights section.
Stay Updated
For the latest updates on blockchain analytics and airdrop trends, follow us on:
Special Offer
Want to gain deeper insights into crypto campaigns? Sign up on Bybit and access analytics-driven trading tools with up to $30,000 in deposit bonuses.


