Can SUI Reverse Its Downtrend? Price Analysis & Market Outlook
Introduction
SUI’s price has been on a rollercoaster ride, experiencing a 31% decline this month before bouncing back with a 9% gain in the past week. This recent uptick has sparked debate among traders—is SUI gearing up for a recovery, or is this just a short-term bounce?
Several technical indicators suggest that selling pressure is easing, but market sentiment remains mixed. Let’s break down the key factors influencing it’s price and whether a sustained uptrend is on the horizon.
SUI’s Price Action: A Shift in Momentum?
SUI is currently trading at $3.39, attempting to recover from recent losses. Despite its weekly gains, trading volume remains low, raising questions about the sustainability of this rebound.
Interestingly, SUI has outperformed Solana (SOL) this week, gaining 17% in the SUI/SOL trading pair. However, its overall performance remains weak, suggesting that investors remain cautious.
Momentum Indicators: Stabilization in Progress
Relative Strength Index (RSI): Currently at 44, up from 33 last week. While this suggests that selling pressure has eased, RSI is still in neutral territory, meaning SUI has yet to establish strong upward momentum.
Money Flow Index (MFI): Increased to 49, up from 27 last week. This indicates rising capital inflows, which could support further recovery.
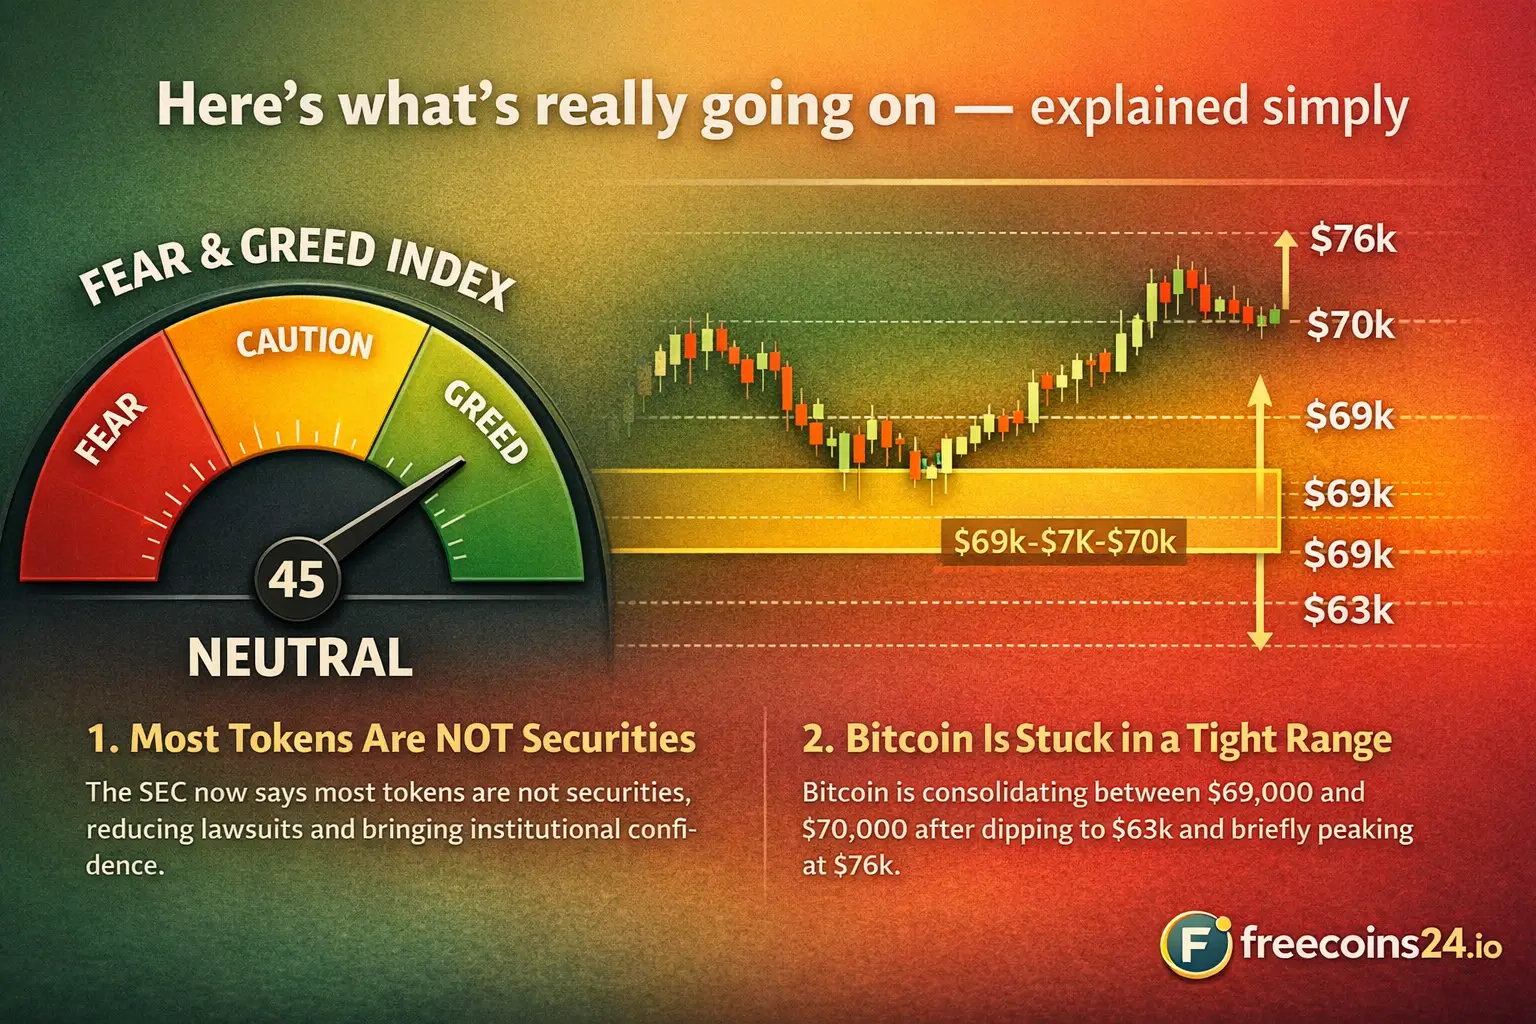
Fear & Greed Index: The broader crypto sentiment has improved, rising from 46 to 54. This shift toward neutrality suggests that investors are regaining confidence in the market.
For a deeper understanding of how broader market trends impact cryptocurrencies, check out Bitcoin Rebounds to $99K – Is the Worst Over?.

Moving Averages: Bearish Signals Still Dominate
Despite some improvement in momentum indicators, moving averages remain bearish:
- 9-day EMA: $3.41 (slightly above current price)
- 26-day EMA: $3.64 (significantly higher than current price)
SUI is still trading below its long-term averages, indicating that the overall trend remains bearish. A breakout above the 26-day EMA would be a positive sign, but until then, caution is warranted.
To see how other cryptos are navigating the market, read Grayscale Files for XRP ETF – What It Means for Institutional Investment.
Trend & Volatility Indicators: What’s Next for SUI?
- ADX (Average Directional Index): 38, suggesting a moderate trend but lacking strong momentum.
- ATR (Average True Range): 0.4, indicating declining volatility, which could signal price stabilization.
- Awesome Oscillator (AO): -0.42, still in negative territory, meaning bearish momentum persists despite some improvement.
- VWAP (Volume-Weighted Average Price): $3.95, higher than the current price, indicating SUI may be undervalued based on trading volume.
For insight into how blockchain innovations are reshaping the industry, explore Understanding Blockchain Technology – The Foundation of Crypto’s Future.
SUI vs. Solana: Short-Term Gains, Long-Term Uncertainty
When compared to Solana (SOL), SUI has outperformed over the past week, gaining 17%. However, it’s still down 8.39% over the past month, highlighting that SUI has yet to reclaim its previous strength.
For more insights on Solana’s performance, check out How Solana Is Reshaping the Blockchain Landscape.
What Could Drive SUI’s Recovery?
For SUI to sustain a long-term recovery, it needs:
✅ Increased trading volume to confirm investor confidence
✅ A breakout above key resistance levels to establish a strong uptrend
✅ Stronger market sentiment as seen in the broader crypto space
If SUI fails to maintain its recent gains, it could face further declines, with support levels at $3.20 and $3.00.
Final Thoughts
While SUI’s recent gains are promising, the downtrend isn’t fully reversed yet. Investors should watch key resistance levels and monitor trading volume before making any major moves.
A decisive breakout above $3.64 could signal a trend reversal, but if selling pressure returns, SUI could revisit lower levels.
To stay informed on the latest crypto trends, read SEC’s Crypto Task Force: What It Means for the Industry.
FAQs
1. Is SUI recovering from its recent downtrend?
SUI has gained 9% in the past week, but technical indicators remain mixed. A true recovery will depend on whether it can break above key resistance levels.
2. How does SUI compare to Solana (SOL)?
SUI has gained 17% against SOL this week, showing relative strength. However, over the past month, it’s still underperforming.
3. What are the key resistance levels for SUI?
SUI needs to break above $3.64 to confirm an uptrend. If it fails, it may retest $3.20 or lower.
4. Should I buy SUI now?
It depends on your risk tolerance. SUI is showing signs of recovery, but bearish signals remain. Consider waiting for stronger confirmation of a trend reversal.
For more insights and detailed guides on cryptocurrency, visit our Crypto Guides Section.
Stay Updated
For the latest updates on cryptocurrency trends and news, follow us on:
- X: https://x.com/FreeCoins24
- Telegram: https://t.me/freecoins24
Stay informed with the latest strategies and insights in the world of cryptocurrency at FreeCoins24.io.
Special Offer
For an enhanced trading experience, consider Bybit. Sign up through our referral link to unlock exclusive rewards, including up to $30,000 in deposit bonuses, and elevate your trading journey.