
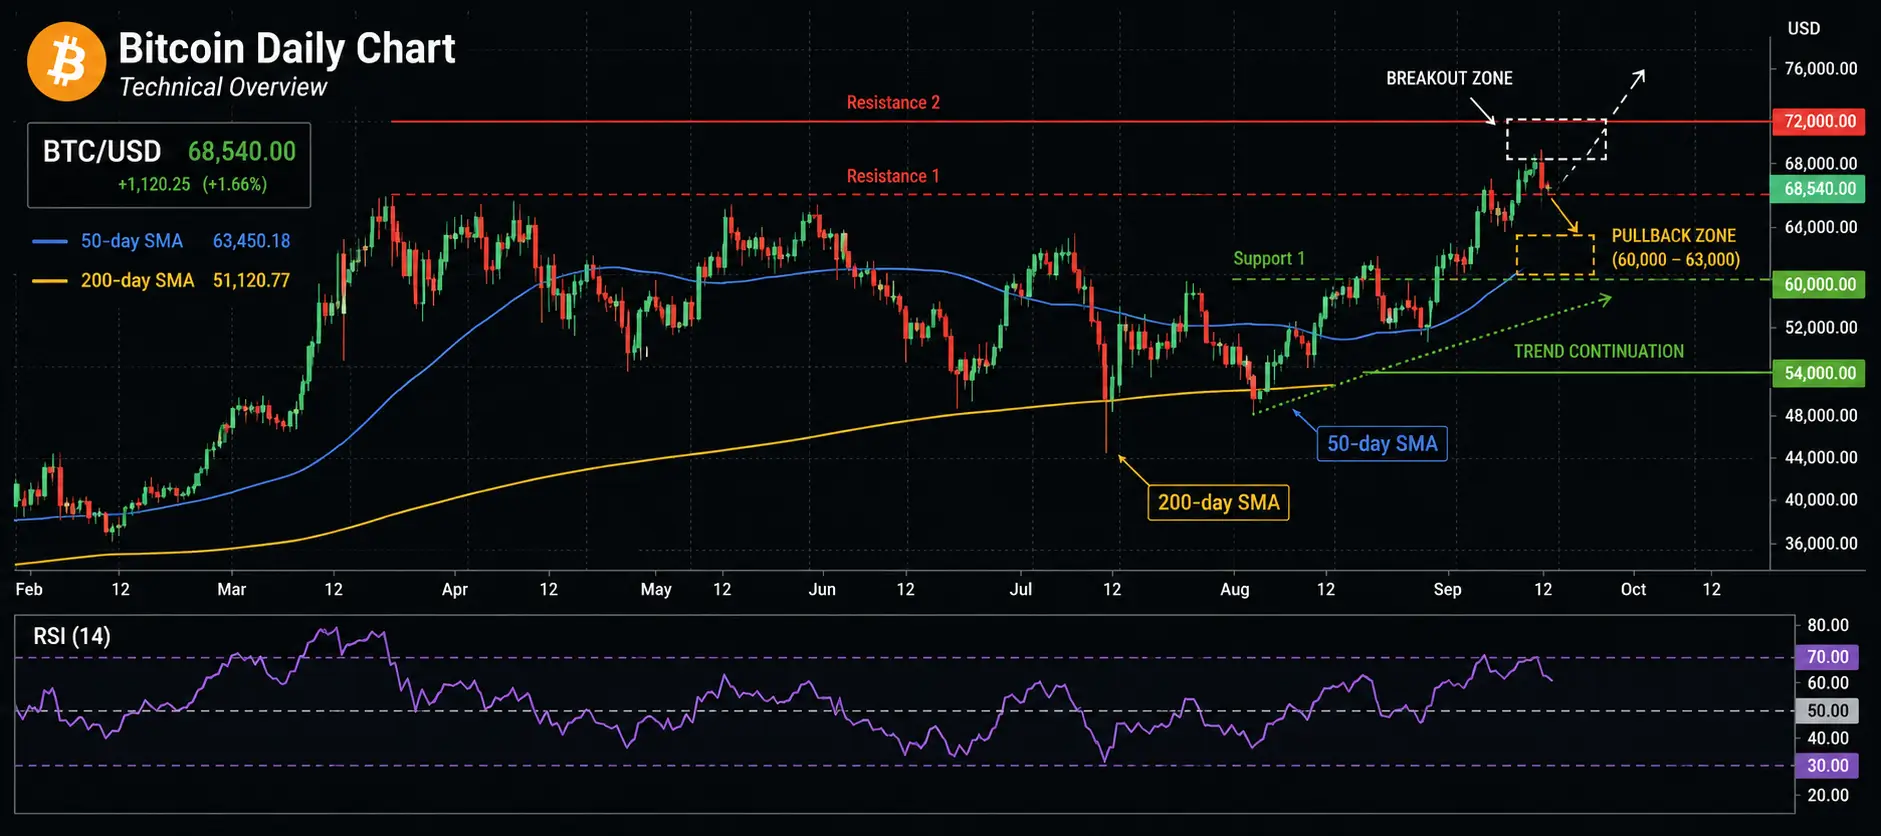
Bitcoin is trading in the mid-$68150’s on aug 19, 2026. That puts it roughly 48-50% below October 2025 all-time high $126,000 and 10-12% above the June 2026 low.
The question hanging over crypto twitter and every timeline right now is simple. Has Bitcoin bottomed?
We are going to look daily chart structure, the broader fundamentals, and the current views of three well-followed Bitcoin analysts on CT. Naming, PlanB, MartyParty and PlanC to give a clear, balanced picture of where we stand in this market.
Current Market Snapshot
Price has spent several weeks building a base between roughly $62,000 and $66,000. The YTD performance remains negative while the 52-week range still stretches from the June lows near $58,500-$59,000 up to the prior highs above $126,000.
On the institutional side, spot Bitcoin ETF flows have shown a modest rebound in August, with month-to-date inflows approaching the $1 billion mark. That provides a constructive backdrop even while price remains range-bound.

Decoding the Daily Chart
The daily structure is the cleanest place to start.
Momentum indicators are mixed but improving. RSI is sitting in the neutral mid-50s to low-60s zone. MACD has begun to show early positive signs after a long stretch of weakness.
The chart is forming a tightening triangle or compression pattern with a series of higher lows from the June bottom. Key support sits at the 50-day cluster, the $62,000–$62,500 zone, and the June lows. Immediate resistance is found between $65,500 and $66,400, with the 100-day and 200-day averages higher still.
The structure looks like classic late-bear or early-bottoming behavior rather than a confirmed new uptrend.
Broader Analytical Context
We are well into the post-April 2024 halving window. Historical patterns leave open the possibility of a final low sometime between September and November 2026, though this cycle has already been shallower than previous ones.
On-chain valuation metrics remain in relatively cold territory. Long-term holders have shown resilience while some whale wallets have continued to accumulate. Realized price continues to act as an important long-term floor reference.
This cycle also carries structural differences like Spot ETFs and corporate treasury buying. Both have created a different demand profile than the pure retail-driven cycles of the past. That helps explain why the drawdown so far has stayed closer to 50% rather than the 80%+ collapses of earlier bears.
What the Analysts Are Saying
PlanB (@100trillionUSD):
According to PlanB, Bitcoin bottoming proces could last one to three months. He has repeatedly noted that previous cycles bottomed below realized price (currently near the low-$50,000s) and has left open the possibility of a further test of that zone.
At the same time he maintains that the October 2025 high was not the cycle top and that the Stock-to-Flow framework still points to a much higher average price this cycle, centered around the $500,000 area for the 2026–2028 window.
MartyParty (@martypartymusic):
In other words, MaryParty has been mapping a Wyckoff accumulation structure for months. His latest schematics place the market in the later stages of accumulation, with Phase D / markup timing potentially arriving in late September or early October.
He views the $58,800-$68,800 zone as the broader accumulation range and treats the persistently negative sentiment as a contrarian positive. His consistent message remains patient self-custody. While he’s pointing out that today’s jump could be a a fake out.
PlanC (@TheRealPlanC):
He has been more constructive on the depth of the correction. According to him, the area around $60,000 already marked the major low and a 50-60% drawdown rather than the classic 80%+ wipeout. He is openly critical of rigid four-year cycle narratives and continues to advance a supercycle thesis that targets $250,000+ into 2027-2028.
Taken together, the three views form a spectrum. PlanB leaves more room for a deeper final flush whereas MartyParty and PlanC see the bottom as largely in or very close.
Is It Time to Buy?
For long-term holders, it’s definitely is, because it’s historically been a reasonable area for DCA. The combination of higher lows, improving ETF flows, and still-depressed valuation metrics supports that approach too.
For shorter-term traders, a deeper retest of the $62,000 area or the June lows that shows clear exhaustion would be a constructive signal.
In every case, position size matters alonside the time horizon, and self-custody remain the non-negotiable risk controls.
Conclusion
Bitcoin is showing the early characteristics of a bottoming process. The most honest answer today is that a local or cycle low is plausible and may already be in, but full confirmation is still missing. Patience remains more valuable than aggression. What to watch is the $65,500–$66,400 resistance zone.
More Bitcoin analysis and market structure pieces in our Market Insights category.
Want More Free Airdrops?
Fresh drops every day — Solana, L2s, perps. Airdrop Calendar Here
Stay Updated
For daily alerts, honest analysis, and the newest airdrop opportunities, follow us on X at @FreeCoins24 and join the conversation on Telegram at t.me/FreeCoins24.
Special Offer
Positioning around Bitcoin levels? Bitunix CryptoMutant event has bonuses, rebates, and perks. Register, deposit $100, unlock. Sign Up & Claim Now
[Picture 3 here: Balanced visual of Bitcoin chart with PlanB, MartyParty and PlanC perspective icons – analytical and calm style]
FAQ: Has Bitcoin Bottomed – August 2026
Q1: Where is Bitcoin trading right now? A: In the mid-$64,000s on August 19, 2026, roughly 48–50% below the October 2025 peak near $126,000.
Q2: What does the daily chart show? A: Multi-week consolidation between $62k–$66k, higher lows from the June bottom, and price holding above a rising 50-day moving average.
Q3: What is PlanB’s current view? A: Bottoming process of 1–3 months is underway. He still sees a possible test below realized price near the low-$50,000s while maintaining higher long-term targets.
Q4: What is MartyParty’s framework? A: Wyckoff accumulation with Phase D / markup potentially arriving in late September or early October. He sees the $58.8k–$68.8k zone as the accumulation range.
Q5: What does PlanC believe? A: The major low was already printed near the $60,000 area in a 50–60% correction. He favors a supercycle thesis targeting $250k+ into 2027–2028.
Q6: Are ETF flows improving? A: Yes. August month-to-date inflows have approached roughly $1 billion, offering a constructive institutional backdrop.
Q7: Is this a confirmed cycle bottom? A: Not yet. The structure is constructive and improving, but decisive confirmation above key resistance is still missing.
Q8: Should long-term holders be buying here? A: Many view the current zone as reasonable for disciplined DCA, provided position sizing and time horizon are respected.
Q9: What levels matter most right now? A: Support at the 50-day / $62k–$62.5k cluster and the June lows. Resistance at $65.5k–$66.4k, then the declining 200-day average.
Q10: What is the biggest risk from here? A: A macro-driven breakdown that retests or undercuts the June lows before any sustained recovery begins.
Where do you stand — bottom in, or one more leg lower still possible? Let me know below 👇